
Quick answer
How are dividends included in stock profit?
Add dividends assigned to the calculation after subtracting the Sell commission from Gross sale value. Then compare Net proceeds with the cost basis assigned to the shares sold.
- 1
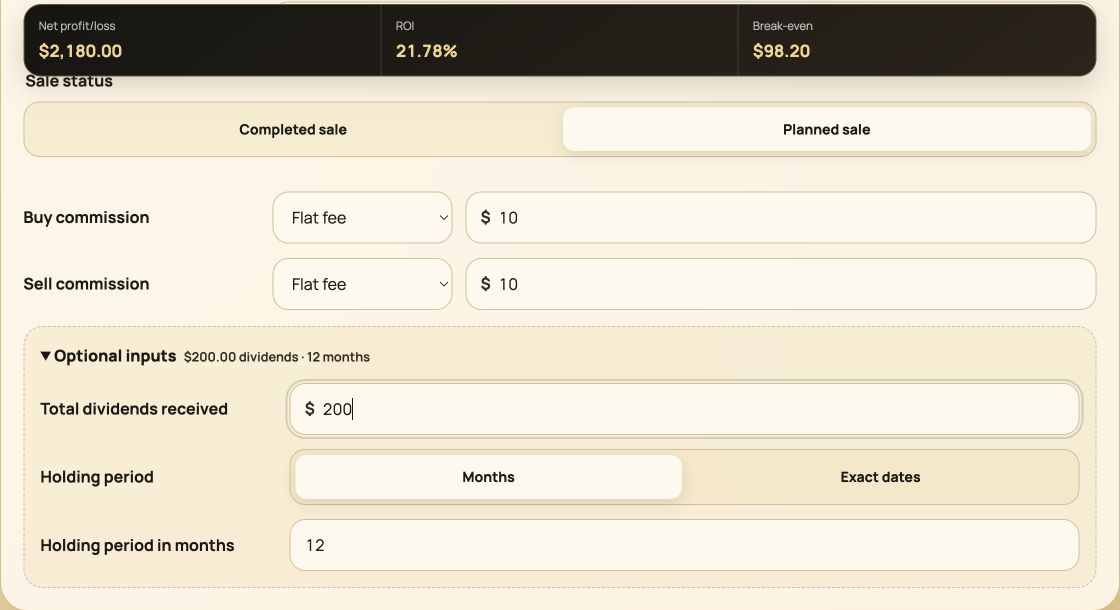
Read Net profit or loss. The $200 dividend increases the reference result from $1,980 to $2,180.
- 2
Check ROI. ROI rises to 21.78% because profit increases while assigned cost basis stays unchanged.
- 3
Enter the dividend total. Quick calculation assigns the entered $200 distribution to this modeled sale.
- 4
Set the holding period. Months or exact dates control annualization; they do not change the dollar profit.
Dividend-inclusive example
$200 in dividends increases net profit to $2,180
Buy 100 shares at $100 with a $10 Buy commission, sell them at $120 with a $10 Sell commission, and include $200 in dividends.
Add the purchase and fee
$10,000 + $10 = $10,010.
Subtract the sell fee
$12,000 - $10 = $11,990.
Add dividends
$11,990 + $200 = $12,190.
Subtract cost basis
$12,190 - $10,010 = $2,180.
Complete result
Dividends add $2 per sold share
Compared with the same trade without dividends, Net profit and Net proceeds each increase by $200. ROI rises to 21.78% and Profit per share rises to $21.80.
- Dividends
- $200.00
- Net proceeds
- $12,190.00
- Net profit
- $2,180.00
- ROI
- 21.78%
- Profit per share
- $21.80
Two input workflows
Enter a dividend total or each dated payment
Quick calculation
Enter Total dividends received as one amount assigned to the current calculation.
Position history
Enter each dividend amount and payment date as a separate positive cash flow.
ROI
Both workflows include the assigned dividends in Net proceeds and Net profit or loss.
XIRR
Only dated dividend entries participate in the cash-flow-aware XIRR calculation.
Read How to Calculate Annualized Stock Return and XIRR before interpreting the dated return.
Chronology
A dividend can fall between different purchase dates
In Position history, a dividend must occur after the earliest relevant purchase and no later than the modeled sale.
A later purchase does not invalidate an earlier dividend. For example, a position may begin in January, receive a dividend in March, add another purchase in June, and be modeled as sold in December.
The calculator does not infer which shares were entitled to a historical payment. Enter only the dividend cash flow that belongs in the modeled position result.
Required sale price
Dividends lower the price needed to break even
In the worked example, the $200 dividend reduces the required gross sale value by the same $200.
The break-even price becomes ($10,010 cost basis + $10 Sell commission - $200 dividends) / 100 shares = $98.20 per share. Without the dividend, the result is $100.20.
See How to Calculate a Break-Even Stock Price for flat and percentage fee formulas.
Methodology and references
Keep dividend inputs tied to the modeled position
Broker statements and company distribution records are the appropriate source for actual payment amounts and dates. The calculator does not retrieve or allocate dividend history automatically.
Ready to calculate stock profit with dividends?
Use the Stock Profit Calculator