
Quick answer
What is the profit per share formula?
Calculate the Net profit or loss for the sale first. Then divide that result by Shares sold.
A positive answer is profit per share. A negative answer is loss per share. For a Full position sale, Shares sold equals the full Number of shares. For a Partial sale, only the shares included in that sale are used.
Calculator walkthrough
How to calculate profit per share with the calculator
Open the stock profit calculator and enter the trade. The calculator determines Net profit or loss before dividing it by the number of shares sold.
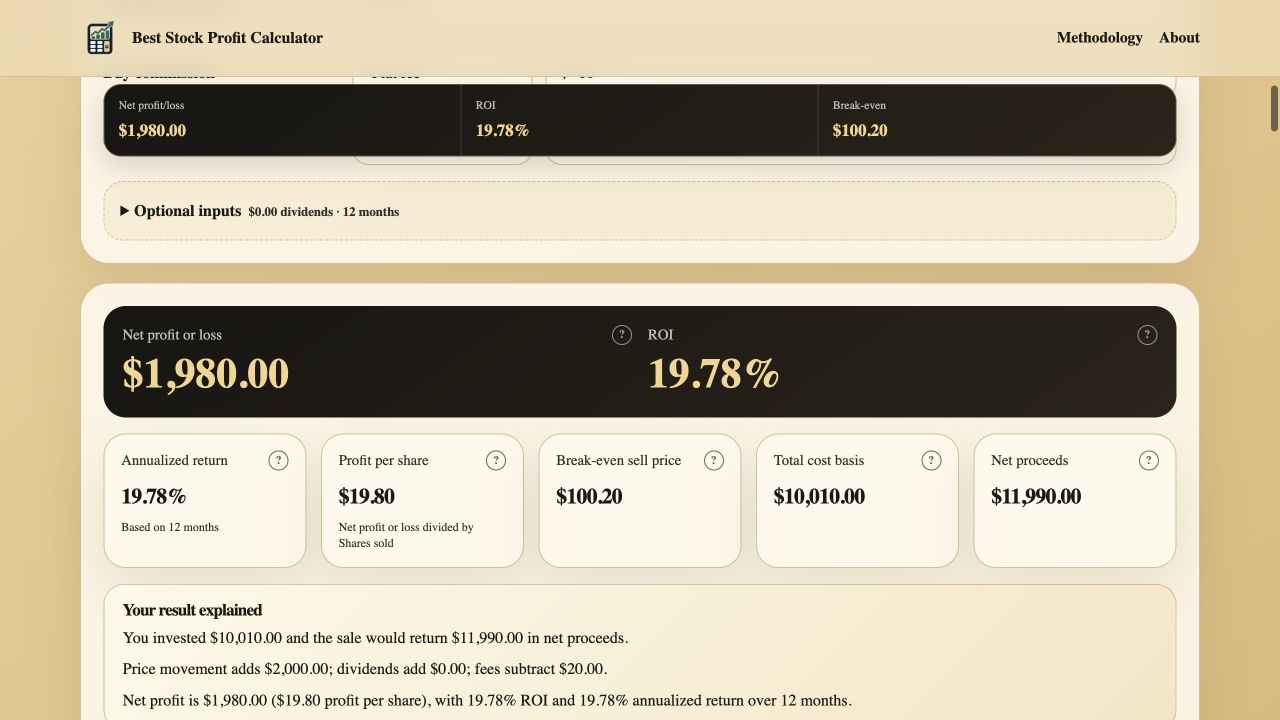
Check Net profit or loss. This is the total result after the sale proceeds, applicable cost basis, commissions, and dividends are combined.
Read Profit per share. The dedicated result divides total Net profit or loss by the shares included in the modeled sale.
Verify the explanation. The dynamic sentence places the total result and the per-share amount together so they can be checked at a glance.
Full-position example
Calculate net stock profit per share after commissions
Suppose you buy 100 shares at $100 per share and pay a $10 Buy commission. You later sell all 100 shares at $120 and pay a $10 Sell commission. No dividends are entered.
Add purchase value and fee
(100 x $100) + $10 = $10,010
Subtract the sell fee
(100 x $120) - $10 = $11,990
Compare proceeds with basis
$11,990 - $10,010 = $1,980
Divide by shares sold
$1,980 / 100 = $19.80
Complete result
Net profit is $19.80 per share
The market price increased by $20 per share, but the net profit is $19.80 per share after the $20 in combined commissions is spread across 100 sold shares.
- Shares sold
- 100
- Price gain per share
- $20.00
- Total fees
- $20.00
- Net profit or loss
- $1,980.00
- Profit per share
- $19.80
- ROI
- 19.78%
What changes the result
How commissions and dividends affect profit per share
Profit per share should use the same net result shown by the calculator. That means trading costs reduce it and Dividends entered for the sale increase it.
Buy commission
The Buy commission is included in Total cost basis. For a Partial sale, only the portion assigned to Shares sold is included.
Sell commission
The Sell commission reduces Net proceeds. A flat $10 fee on 100 shares reduces profit by $0.10 per share.
Dividends
Dividends increase Net proceeds in this calculator. A $100 dividend allocated to 100 sold shares adds $1 per share.
Percentage fees
Percentage commissions change with transaction value, so their per-share effect can differ as Buy price per share or Sell price per share changes.
| Metric | Formula or source | Result in the example | What it answers |
|---|---|---|---|
| Profit per share | Net profit or loss / Shares sold | $19.80 | How much net profit each sold share produced. |
| Price gain per share | Sell price per share - Buy price per share | $20.00 | How much the stock price changed before fees. |
| ROI | Net profit or loss / Total cost basis x 100 | 19.78% | How efficient the trade was relative to cost basis. |
| EPS | Company earnings metric | Not a calculator result | How company earnings relate to common shares. |
Partial-position example
Calculate profit per share on a partial stock sale
Assume you bought 100 shares at $50 with a $10 Buy commission. You sell 40 shares at $65 and pay a $5 Sell commission. The calculator allocates $2,004 of cost basis to the shares sold and calculates $2,595 in Net proceeds.
The exact result is $14.775 per share and is displayed as $14.78. The unsold 60 shares are not part of the denominator. For multiple purchases, FIFO, LIFO, or Specific lots determines which cost basis is assigned before profit per share is calculated. See the detailed partial stock sale guide for worked lot-selection examples.
Avoid a common mix-up
Profit per share is not EPS, ROI, or price change
These measurements answer different questions. The calculator uses Profit per share only for the investor's modeled stock sale.
Profit per share
Your Net profit or loss divided by Shares sold. It is a dollar amount tied to one modeled transaction.
Earnings per share (EPS)
A company metric based on company earnings and common shares. It does not describe the profit on your personal trade.
ROI
Net profit or loss as a percentage of the applicable cost basis. ROI makes differently sized trades easier to compare.
Price gain per share
Sell price per share minus Buy price per share, before commissions and dividends. It may be higher than net Profit per share when fees apply.
Before relying on the estimate
Common profit-per-share mistakes
Dividing by shares owned
For a Partial sale, divide realized profit by Shares sold, not by all shares remaining in the account.
Ignoring commissions
Subtracting Buy price per share from Sell price per share gives price movement, not net profit per share after fees.
Using the wrong purchase lot
With Multiple purchases, the selected FIFO, LIFO, or Specific lots can change Cost basis of shares sold and the resulting profit per share.
Rounding too early
Keep the unrounded total profit through the calculation and round the final per-share result to the desired currency precision.
Dividing cumulative profit by current shares
When Previous sales exist, the displayed Profit per share belongs to the current modeled sale only. Cumulative profit in Position sale history covers different sale quantities and should not be divided by the current Shares sold.
Methodology and references
Use transaction records for the underlying values
Profit per share is only as accurate as the sale proceeds, cost basis, commissions, dividends, and share quantity used to calculate Net profit or loss.
Ready to calculate stock profit per share?
Use the Stock Profit Calculator